Vance County Demographics
![]()
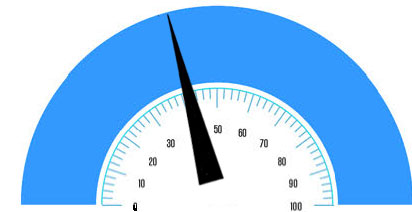
45,033

40.2
![]()
17,440
Summary
Census 2010
2018
2023
Population
45,422
45,033
44,796
Households
17,395
17,383
17,311
Families
12,028
11,884
11,784
Average Household Size
2.56
2.55
2.55
Owner Occupied Housing Units
10,765
9,852
9,936
Renter Occupied Housing Units
6,630
7,531
7,375
Median Age
38.4
40.2
41.5
Trends: 2018 - 2023 Annual Rate
Area
State
National
Population
-0.11%
1.13%
0.83%
Households
-0.08%
1.1%
0.79%
Families
-0.17%
1%
0.71%
Median Household Income
1.01%
1.93%
2.5%
Households by Income
2018 Number
2018 Percentage
2023 Number
2023 Percentage
<$15,000
3,904
22.50%
3,741
21.61%
$15,000 - $24,999
2,395
13.80%
2,254
13.02%
$25,000 - $34,999
2,051
11.80%
1,947
11.25%
$35,000 - $49,999
2,610
15.00%
2,516
14.53%
$50,000 - $74,999
2,970
17.10%
3,016
17.42%
$75,000 - $99,999
1,608
9.30%
1,741
10.06%
$100,000 - $149,999
1,167
6.70%
1,353
7.82%
$150,000 - $199,999
380
2.20%
432
2.50%
$200,000+
298
1.70%
311
1.80%
Population by Age
Census 2010 Number
Census 2010 Percentage
2018 Number
2018 Percentage
2023 Number
2023 Percentage
0 - 4
3,102
6.83%
2,806
6.23%
2,675
5.97%
5 - 9
3,198
7.04%
2,948
6.55%
2,805
6.26%
10 - 14
3,122
6.87%
2,923
6.49%
2,936
6.55%
15 - 19
3,480
7.66%
2,810
6.24%
2,878
6.42%
20 - 24
2,830
6.23%
2,764
6.14%
2,439
5.44%
25 - 34
5,030
11.07%
5,608
12.45%
5,281
11.79%
35 - 44
5,890
12.97%
5,148
11.43%
5,160
11.52%
45 - 54
6,430
14.16%
5,782
12.84%
5,415
12.09%
55 - 64
5,919
13.03%
6,200
13.77%
6,043
13.49%
65 - 74
3,593
7.91%
4,958
11.01%
5,420
12.10%
75 - 84
2,040
4.49%
2,219
4.93%
2,846
6.35%
85+
788
1.73%
867
1.93%
898
2.00%
Race and Ethnicity
Census 2010 Number
Census 2010 Percentage
2018 Number
2018 Percentage
2023 Number
2023 Percentage
White Alone
20,058
44.16%
18,867
41.90%
18,016
40.22%
Black Alone
22,645
49.85%
23,011
51.10%
23,181
51.75%
American Indian Alone
147
0.32%
179
0.40%
201
0.45%
Asian Alone
202
0.44%
203
0.45%
206
0.46%
Pacific Islander Alone
7
0.02%
7
0.02%
7
0.02%
Some Other Race Alone
1,754
3.86%
2,063
4.58%
2,390
5.34%
Two or More Races
609
1.34%
703
1.56%
795
1.77%
Hispanic Origin (Any Race)
3,051
6.72%
3,551
7.89%
4,000
8.93%
Educational Attainment 2018
Area
State
National
Associate's Degree
9.85%
9.70%
8.45%
Bachelor's Degree
9.03%
20.00%
19.60%
Graduate Degree
3.60%
11.13%
12.18%
Data Source: ESRI, U.S. Data Only
ADD ITEM TO REPORT
As you navigate our website, you can use the “Add Page to Report” button to add any page or property to a custom report that you can print out or save.


